Thursday, December 9, 2010

Lab4-Forgot to submit

  
Projecting a map is a method of representing the surface of the earth on a flat plane. Map projections are essential for producing various types of maps. Map projections are used to most accurately illustrate the different assets of the planet. Equidistant protects distance from a point or line. There are a variety of map projections, Conformal is one map projections, and it protects angles locally. Equal-area protects area.                         
            For the conformal projection I used Gall-Stereographic and Mercator. These maps projections help protect the shape of small objects, but alter larger objects. One use form theses two projections are, they allow the viewer to understand the basic representations of the world’s countries. One downside for these projections is the size. For example the size of the United States in the projection shows the United States almost as big as the entire continent of Africa. In fact, the continent of Africa is almost 80 percent larger than or more than 3 times as big as the United States. The distance from Baghdad to Washington D.C. in the Gall-Stereographic projection is roughly 9,577 kilometers. In the Mercator projection the distance is from Washington to Baghdad is roughly 13,538 kilometers.
            For the Equal-Area projections I used the Hammer Aitoff and Cylindrical projections. These projections are good when you are trying to figure out the area of specific country or landmass. When I did the measurements, the distance from Washington D.C. to Baghdad came out to 13,524 kilometers in the Cylindrical projection. In the Hammer projection the measurements from Washington D.C. came out to 11,200 kilometers.   In the Equidistant I choose the Carree and the Sinusoidal projections. One interesting fact about the Sinusoidal projection is it can be either an Equal-Area projection or an Equidistant projection.  The Carree projection is an extremely simple and basic projection. In the Carree projection the distance from Washington D.C. to Baghdad was roughly 13,529 kilometers. In the Sinusoidal projection the distance from Washington D.C. to Baghdad was approximately 10,833 kilometers.
There are a variety of map projections that have their benefits, but with each map projection there are downsides. Equal-Area, Conformal, and Equidistant projections work best with different variety of maps someone is trying to convey. It is up to the creator to distinguish from which projection they think might best illustrate their map.


1. What is an ellipsoid? How does an ellipsoid differ from a sphere?
An ellipsoid is a sphere that is slightly flattened at the poles. It is wide at the poles and flat on the north and south. An ellipsoid is also accepted as the best geometric model of the earth’s surface
2. What is the imaginary network of intersecting latitude and longitude lines on the earth's surface called? The imaginary network that intersects latitude and longitude on earth’s surface is called a Geographic Coordinate System.
3. How does the magnetic north differ from the geographic North Pole?  The magnetic north is where a compass points to.  The Geographic North Pole is located at one of the poles of the earth's axis of rotation. There are two components to datums, a specified ellipsoid, and a set of surveyed coordinate locations specifying horizontal positions or vertical positions on the surface of the Earth.
4. Why are datums important? Briefly describe how datums are developed. A datum is a 3-dimentional frame of reference used to determine surface locations. It attempts to approximate the ellipsoid.
5. What is a map projection? A map projection is used to transfer locations from the curved earth's surface onto a flat surface.
6. What is a developable surface? A developable surface is one that can be obtained from a plane sheet by deformation.
7. Which lines on the graticule run north-south, converge at the poles, and mark angular distance east and west of the prime meridian?  The lines of longitude.
8. Which of the following ellipsoids is now regarded as the best model of the earth for the region of North America? GRS80 is the best model of the earth for the North American region.
9. Which well known coordinate system would be appropriate to use for developing and analyzing spatial data when mapping counties or larger areas? Why? The State Plane Coordinate System is the more appropriate system to use for developing and analyzing spatial data when mapping counties or larger areas. It is designed for specific regions of the U.S., and each state contains state plane zones, boundaries of which usually follow county lines.
10. What is a great circle distance? A great circle distance is the shortest distance between two points on the surface of the globe.

Wednesday, November 24, 2010

Lab10


1. Would you have more problems with feature generalization and omission in large or small scale maps? Why?
You would have more complications with feature generalization and omission with small scale maps due to surface errors that arise.

2. What is snapping in the context of digitizing? Why is snapping important (i.e. what does it help avoid)?
Snapping in the context of digitizin is putting two or more nodes with a given distance between another to become a single node, and it is important in order to avoid over and under shots.

3. What is COGO and how does it relate to coordinate surveying?
COGO is coordinate geometry which is a common output from survey measurement spaital data that consists of a starting point with a list of directions and distances to subsequent stations.
Q: What is the feature class type (point, line or poly) for Springs?Point


Monday, November 8, 2010

Lab9b

1. How many counties does the State of Iowa contain? (1 pt)
99 counties


2. Which county in Georgia contains the largest number of people, as of the year 2001? (1 pt)
Fulton

3. How many cities, with populations between 10,000 and 49,000, are located within the State of Washington? (1 pt)
32 cities

4. How many miles long are all of the interstates in Los Angeles County? (1 pt)
4105 miles

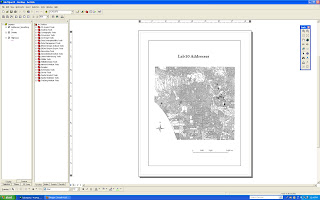
5. Simplify the UrbanBoundaries feature class so that only the urban areas of Los Angeles County are visible (Hint: you must use one of the overlay functions). Create a new feature class and save it into the LosAngeles dataset using the name LA_Urban. Include a screenshot of this new layer with your assignment. (2 pts)


6. How many acres of urban area lie within Los Angeles County, based upon your results from question #5? ( 1 pt)

1441652.796
7. How many zip codes have their centroid in Los Angeles County? (1 pt)
522

8. Create a layer displaying the provinces of Canada using the data provided to you in the Canada feature dataset. Save this new layer under the Canada feature dataset using the name Provinces. Include a screenshot of this new layer with your assignment. (2 pts)


9. Which Native American Indian Reservations lie within 75 miles of the City of Thurso in Canada? (1 pt)
Kitigan Zibi Indian Reserve, Doncaster Indian Reserve 17, Kanesatake Indian Reserve 16, Akwesane Indian Reserve


Wednesday, November 3, 2010

Lab9.a


I.                   1.      What is spatial scope and what are the three types? The extent or area of the input data that are used in determining the values at output locations. Types- Local operation, Neighborhood, Global operation.

2.      What are the two types of Algebra used in queries?  Give an example of each.  


Less than <    Greater than >    Equal to =     Not equal to <>


3.      What are the different types of spatial selection operations?                        
                  By Attributes-Set Algebra, Boolean Algebra
By Spatial characteristics- Adjacency, Containment
 II.               

4.   Is there a feature dataset in the geodatabase? Yes, Los Angeles feature dataset.
5.   What features classes are present?  PtDumeQuad, Vegetation, Wetlands, Wetlands_Project.

III.                Exercise 1: Prepare (simplify) a vegetation layer for the Los Angeles region for further spatial analysis.
6.   How many features (records) exist in the Vegetation feature class in the Lab9aData.mdb geodatabase?  Number of records: 10896

7.   How many features (records) exist in the new VegCov feature class after running the dissolve operation? 9 records
8.   How many features (records) exist in the new “VegCov_Clip” feature class?  1450 records

IV.               Exercise 2: Generate a layer of Riverine wetlands that fall in the Point Dume quad.
§  Use the Select By Location tool to determine how many total wetlands have their centroid in the Point Dume quad.
9.   How many wetland features (records) were selected?  404 records were selected 
10.   How many features (records) were selected?  123 records
§  Export only these selected Riverine wetlands into a new shapefile named “Riverine_FirstInitialLastName”. Make sure to place this new shapefile inside your working directory for Lab 9a on C:/.  Ex. Riverine_rmaas.
§  Capture a screenshot (Alt PrtScr) of your final Riverine layer and paste it into this document.


Wednesday, October 27, 2010

Lab8 1. What are the primary functions of a database management system? The primary functions of a database management system is for organizing and manipulating data. 2. What is a one-to-one relationship between tables? A many-to-one? A one-to-one relationship between tables is the matches in the nonspatial table in which one table can have no more than one matching row in another table. A many-to-one relationship table is when a table has several matching rows with another table. 3. Why are relational databases so popular (i.e. what are the benefits)? Relational database have several benefits to them, so consist of having series of tables with contain data. In this tables there are rows and coulmns. Rows contain the records while the columns contain the fields. The attribute data stored in the tables can be queryed for flexibility. The coordinate data is stored in a network database. a. What is the Data Type of the LAND_USE field in the Landuse feature class? SHAPE FILE, SPATIAL DATA b. What is the Data Type of the LAND_USE field in the LanduseInfo.dbf table? TEXT, TABULAR DATA, ATTRIBUTE DATA a. Join the LanduseInfo.dbf file TO the Landuse feature class. Explore the table. What are the new fields that have been joined (appended)? The SHAPE Field, LU_DESCRIP, LANDUSE, LU_TYPE, SQMILES, ACRES, e. How many total acres of Open Lands (including Open Land Uses) exist in this new feature class? 280645

Wednesday, October 13, 2010

Lab7


1. The information used for dynamic labels comes from where?
 Layer attribute tables


2. You are making a map of Los Angeles and have a point layer that shows all the cities in the region. However, you want to show city names for only 3 cities. What is the most efficient way to achieve this?  Label tool on the drawing toolbox


3. Can you manually adjust the position of dynamic labels?
No you can not.

4. Which tool needs to be selected to adjust graphics?
The elements tool.

5. What are the two annotation types?
Database and map annotations.

Ch. 18


1. You are able to construct your own ArcMap templates.

a. True

b. False


2. If you create a map based on an ArcMap template file (.mxt), can you save it as an .mxd file?
Yes, you are able to save it as an .mxd

3. Describe two different ways you can access map templates.
By clicking on file menu and clicking on new. The other way is the ArcMap dialog box


4. You are adding five point graphics to your map. Instead of having to change the properties for each one after you add it, you want to set the default point symbol to a size 12 purple star. How do you do this?  Click on the desired symbol  which you wish to alter and then select the star symbol and change the color and size.

5. Describe two different ways you can change the color of a graphic circle. You can right-click on the symbol and change the color.The other way is to simply clicking on the symbol and change the color.


Ch. 19


1. What is the first thing you should always do before setting up your map layout?
The first thing you should do before setting up your map layout is set up the page size.


2. Why is the scale different in the data view versus the layout view?  The layout view had sized up to the page. In the layout view, it previews the page to see how it will end up of printed.

3. What are three customization options available for the scale bar? The three customization options available for the scale bar are format, units and scale, marks and numbers.

4. Why is it important to use the 1:1(Zoom to 100%) button?
You should use the 1:1 button to stay away from mistakes. It help you view the entire layout so you see everything your working with.

5. Explain how a graphic added to your data view would respond differently compared to a graphic added to the layout view when navigating around your map.
 The data view we are able to view single layers at a time, and you are unable to modify and include things such as a title and a legend.

Part 2:
Q-1: Choropleth maps are a type of thematic map. Define what we mean by a choropleth map.

Choropleth maps are comprised of areas that are shaded  in sections to the extent or size of the statistical variable.

Q-2: Read about layer files in the ArcGIS Desktop Help. Describe their benefits.
Layer files have the map display properties for labeling and symbolization.

Q-3: How do layer files differ from layer packages?
Layer files do not contain the datasets. Layer packages allow sharing of data. Layer packages contains the layer and a duplicate of its data.

Q-4: What is the population of City of Long Beach for the year 2000?
The population of the city of LB for the year 2000 is 461,522.

Q-5: What is the population for the City of Los Angeles in 2000?
The population for LA in 2000 is 3,694,820

Q-6: Using the ArcGIS Desktop Help, describe the three types of hyperlinks that can be created.
Hyperlinks have to be defined before you use the Hyperlink tool, and they can be one of three types:   The three types of hyperlinks that can be created are document, URL, macro. In document, clicking on feature brings up a document. In the URL, clicking on the feature will take you to a website associated with it. In macro, a value is fired up into the macro. 

Friday, October 8, 2010

Lab6

1.In your own words, describe how symbology can be influenced by scale.
Symbology can be influenced by scale; one way is the changing of the appearance. The symbol appears different when the scale is skewed.

2. What are two ways (one direct and one indirect) to access a layers symbol colors so that they can be changed? One way is to go directly to the layers panel on the table of contents and right-click on the color for the selected symbol; and then simply change the color of the symbol. One other way is to single click on the symbol you wish to alter. A symbol selector box appears in which you are able to change the fill color and the outline color of the symbol.

3. How would you access the graduated symbols classification option? By double-clicking a layer, then going to the symbology tab, and then going to quantities and graduated symbols.

4. What are 5 other symbology styles (in addition to ‘Conservation’) that are available to customize your features? Five other symbology styles in addition to Conservation are: Crime Analysis, Environmental, Forestry, Hazmat, and Petroleum.

5. How could you permanently save layer symbology for use later on?
By going to the symbol selector properties and simply saving the layer symbology to where ever you want.

6. How can pyramids help raster data display faster? Pyramids document the original information in descending stages of resolution, which in affect help it display quicker.

7. How could you quickly and temporarily change a layer name to aid display in the Table of Contents? By single-clicking on the layer, and simply changing the name of the layer.

8. What is normalization? Give an example of when it would be used.
Normalization is dividing one attribute by another to find the ratio between them. A simple example of when it would be used is between population and area.

9. How could dot density maps be misleading?
They can be misleading enough or large enough to venture outside their symbolized area and confuse the reader.